How to Use Signify Organization Analytics
Signify Organization Analytics helps your organization understand how its digital business cards perform. Review monthly card views, leads and contact saves across your team to see which cards are attracting attention and encouraging people to connect.
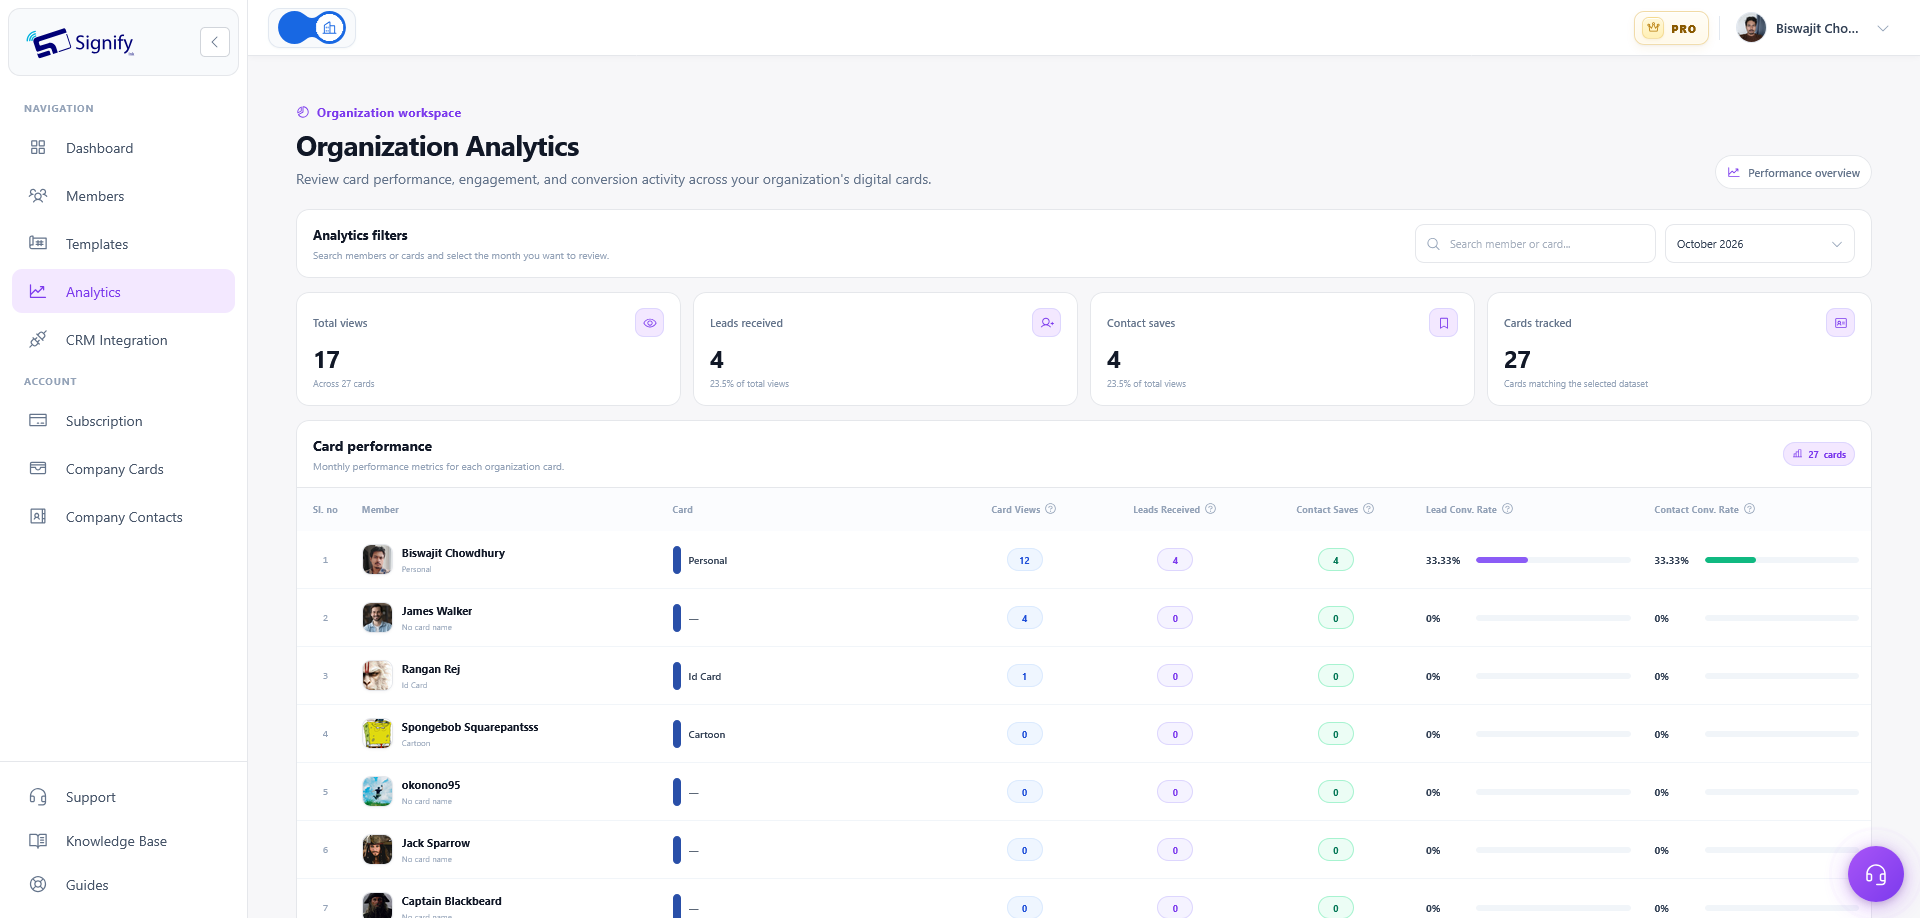
Use the month selector, member and card search, performance table and conversion rates to compare results across your organization's cards—all from the organization analytics page.
What Is Signify Organization Analytics?
Organization Analytics gives your team a consolidated view of digital business card activity. Instead of reviewing every card separately, you can compare views, leads and contact saves across the cards represented in your organization.
The page combines organization-wide summary metrics with a card-by-card performance table. This makes it easier to identify which cards receive the most views and which turn those views into leads or contact saves.
1. Open Organization Analytics
- Sign in to your Signify account with access to your organization workspace.
- Open the Organization Dashboard.
- Navigate to the organization's Analytics page.
When the page opens, it defaults to the current month. You can select another available month and search for a member or card to investigate specific results.
2. Choose a Month and Find a Card
Select a Month
Use the month dropdown to choose the period you want to review. The page opens to the current month and offers months from the start of your team's activity through the present.
Search by Member or Card Name
Enter a member's name or a card name in the search field. The results table filters as you type, helping you locate the cards you want to compare.
Important: Changing the month updates both the summary cards and the performance table. Searching filters only the table and its result count. The summary cards continue to show totals across all organization cards for the selected month, even when the table is filtered.
3. Understand the Organization Summary
The summary cards provide a high-level view of your organization's performance for the selected month. They are organization-wide totals, not just totals for the cards currently visible after searching.
Total Views
The combined number of views across the organization's cards during the selected month.
Leads Received
The combined number of leads received through the organization's cards during the selected month.
Contact Saves
The combined number of contact saves, including VCF downloads, across the organization's cards.
Cards Tracked
The number of organization cards represented in the results for the selected month.
4. Compare Individual Card Performance
The results table breaks down monthly activity by card. Each row includes the team member, card name and performance metrics. If a member has multiple cards, each card appears in its own row.
| Metric | What It Measures |
|---|---|
| Card Views | How many times the card was viewed during the selected month. |
| Leads Received | How many leads were received through that card during the selected month. |
| Contact Saves | How many times the card was saved as a contact or downloaded as a VCF. |
| Lead Conv. Rate | The percentage of card views that resulted in leads, calculated as leads divided by views. |
| Contact Conv. Rate | The percentage of card views that resulted in contact saves, calculated as saves divided by views. |
The table's colored bars provide a quick visual comparison of conversion rates. They help you spot differences between cards without needing to compare every percentage manually.
5. Understand Lead and Contact Conversion Rates
Views show how often people open a digital business card. Conversion rates help you understand how often those views lead to a further action, such as sending a lead or saving contact information.
Lead Conversion Rate
Leads Received ÷ Card Views × 100
Contact Conversion Rate
Contact Saves ÷ Card Views × 100
Example: Lead Conversion
Suppose a card receives 200 views and 10 leads in a month. Divide 10 leads by 200 views and multiply by 100. The lead conversion rate is 5%.
Example: No Views
If a card has no views during the selected month, its lead and contact conversion rates display as 0%. There are no views to use as the denominator for the calculation.
A higher conversion rate means a larger proportion of recorded views resulted in that action. Consider both the rate and the total number of views when comparing cards; a percentage alone does not show the full amount of activity.
6. Use the Results to Improve Team Performance
Organization Analytics can help your team understand which digital business cards are attracting attention and which are encouraging people to connect. Use the metrics as a starting point for team discussions and follow-up.
Identify Cards Getting the Most Views
Compare Card Views to see which profiles are receiving the most attention during the selected month.
Review Which Cards Generate Leads
Compare Leads Received and Lead Conversion Rate to understand which cards are turning views into leads. Use the results to guide appropriate follow-ups.
Understand Contact Saves
Review Contact Saves and Contact Conversion Rate to see which profiles are encouraging people to save contact information or download a VCF.
Compare Results Across Team Members
Search for individual members or card names to examine specific rows. Use the results to discuss what's working and identify opportunities to improve card details or networking follow-up.
7. Know What Organization Analytics Includes
The page focuses on monthly totals and calculated conversion rates across organization cards. Its filters are designed for selecting a month and finding cards by member or card name.
- The month selector updates organization-wide summary metrics and the performance table.
- Search filters the table and its result count, not the organization-wide summary totals.
- Each card appears as its own row, including when one member has multiple cards.
- Conversion rates are calculated from leads or contact saves divided by views.
- The page does not currently provide a date-range selector or a separate export control.
Frequently Asked Questions
What does Signify Organization Analytics track?
It tracks organization-wide and card-level views, leads received and contact saves for the selected month. It also displays lead and contact conversion rates for individual cards.
Can I view analytics for a particular team member?
Yes. Search by a member's name or card name to filter the results table. The summary cards continue to display organization-wide totals for the selected month.
Why does a member appear in multiple rows?
Each card has its own row. If a team member has more than one card, each card appears separately so you can compare their individual performance.
How is lead conversion rate calculated?
Divide Leads Received by Card Views and multiply by 100. For example, 10 leads from 200 views gives a lead conversion rate of 5%.
How is contact conversion rate calculated?
Divide Contact Saves by Card Views and multiply by 100. Contact Saves include contact saves and VCF downloads.
Why does a card with no views show a 0% conversion rate?
When a card has no views in the selected month, its conversion rates display as 0%.
Does searching change the summary cards?
No. Searching filters the performance table and its result count. The summary cards continue to show totals across all organization cards for the selected month.
Can I select a custom date range or export analytics?
The page currently provides a month selector rather than a custom date-range selector. It also does not currently provide a separate export control.